Using Flask And Python To Visualize Foursquare Swarm Data
Introduction
Foursquare Swarm is a mobile application that allows you to check in to locations (places of interest, restaurants, etc).
I have been using Swarm since 2012 as a way to track where I’ve been. Far too many times I try to think about a restaurant I went to try months ago and unsucessfully recall the name of it. I think 98% of the time I visit somewhere, I check in on Swarm.
It’s also fun to use when I’m on vacation and I want to track all the places I visited!
In the past, there have been ways to download all your check-in data from Swarm. But recently the API has changed and it requires OAuth2 to authenticate yourself and provide permissions for the webapp.
Web Application Workflow
Since I found no solution online, I made a web application to download all your Swarm data, which does the following:
- Authenticate Swarm user through OAuth2.
- Uses Foursquare API to get all the check-in history.
- Parses through data to create a file output in JSON or CSV.
- Use Mapbox API to create a heatmap centered on the city you most frequently have data for.
Methods Used
I used the following methods to accomplish this:
- Host my web application on pythonanywhere.com.
- Use Flask as the web framework to deliver content.
- Create the site with the Jinja2 template engine and Bootstrap for CSS.
- Parse data using Python.
- Create developer accounts with Mapbox and Foursquare to work with APIs.
You can view the code I wrote on GitHub. There’s a lot more that can be done to improve this web application. Anyone who wants to run this on their own PythonAnywhere account will be able to fork the repo and only make minor modifications.
My motivation for creating this was more for the learning experience as well as having the ability to download my check-in data.
Try downloading your Foursquare Swarm history!
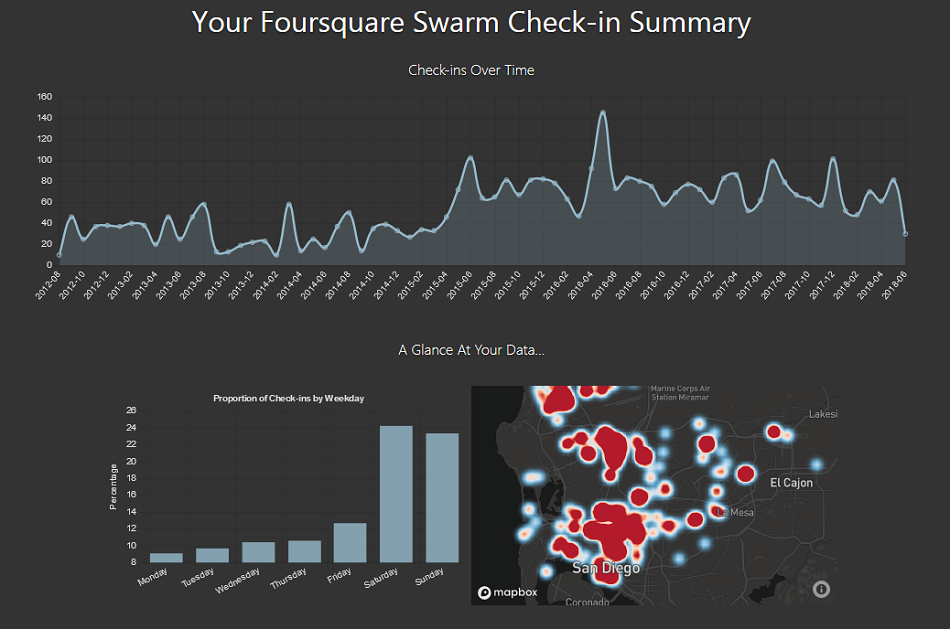
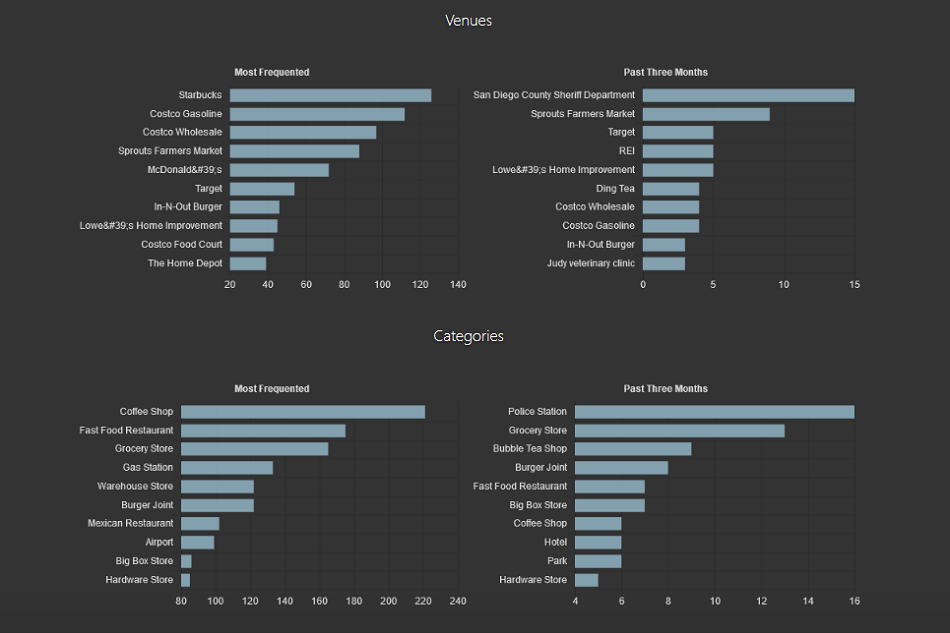
Example Output
Here’s a preview of what’s generated from all that data.
Leave a comment